Real-time metrics
PgDog Enterprise collects and trasmits its own metrics to the control plane, at a configurable interval (1s, by default). This provides a real-time view into PgDog internals, without a delay that's typically present in other monitoring solutions.
How it works
Real-time metrics are available in both Open Source and Enterprise versions of PgDog. The open source metrics are accessible via an OpenMetrics endpoint or via the admin database.
In PgDog EE, the same metrics are collected and sent via a dedicated connection to the control plane. Since metrics are just numbers, they can be serialized and sent quickly. To deliver second-precision metrics, PgDog EE requires less than 1KB/second of bandwidth and little to no additional CPU or memory.
Configuration
The intervals at which metrics are uploaded to the control plane are configurable in pgdog.toml:
[control]
metrics_interval = 1_000 # 1s
endpoint = "https://control-plane-endpoint.cloud.pgdog.dev"
token = "cff57e5c-7c4f-4ca0-b81c-c8ed22cf873d"
The default value is 1 second, which should be sufficient to debug most production issues.
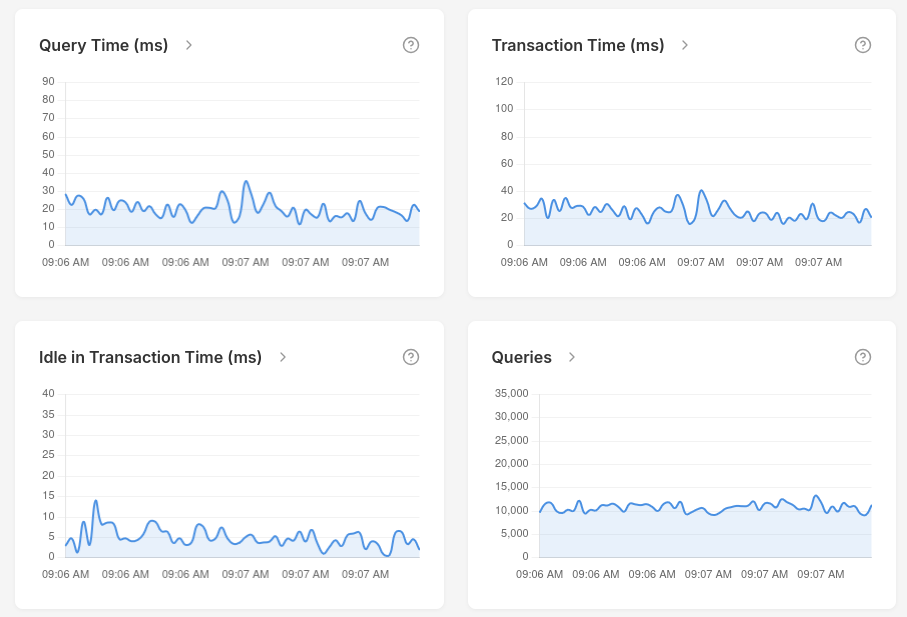
Web UI
Once the metrics reach the control plane, they are pushed down to the web dashboard via a real-time connection. Per-minute aggregates are computed in the background and stored in a separate PostgreSQL database, which provides a historical view into overall database performance.